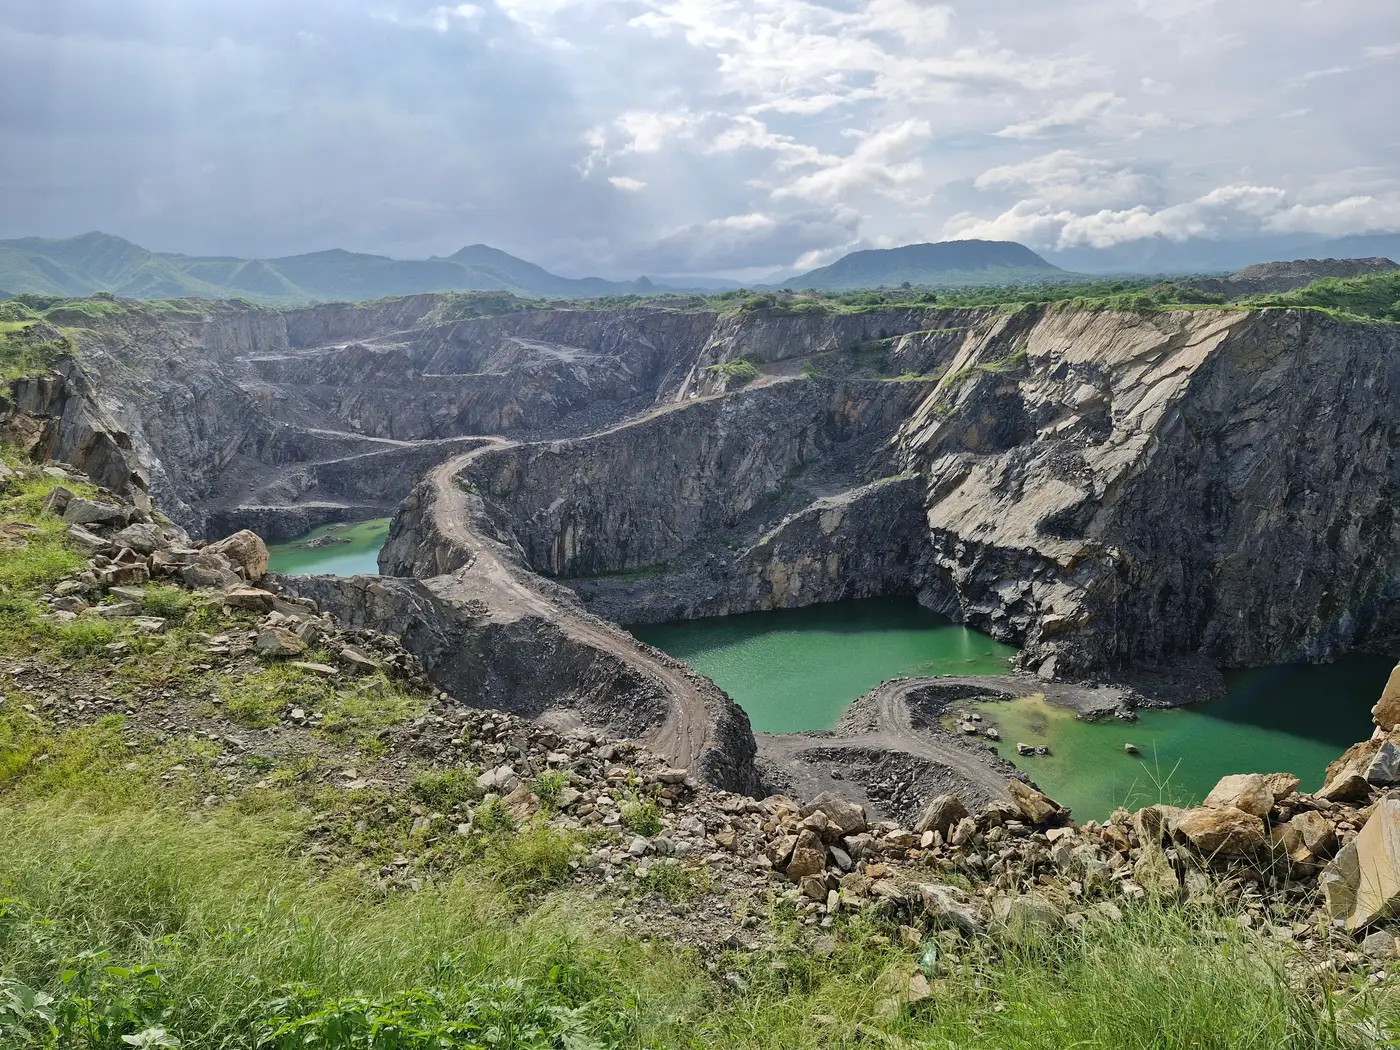
The first quarter of any site screen is a let-down. You run the layer, you get a map, and the map mostly just shows you a tailings pond and a processing yard sitting exactly where the company's own site plan says they sit. No red flags. No change log worth writing up. A junior analyst's instinct is to call that a null result and move on to the next holding in the book.
The baseline is the result. It's the honest picture of what the site looked like before you started asking it questions, the one every later quarter gets measured against.
We ran this against a mid-cap metals position last year, a processing site with a tailings storage facility a few kilometers from a river system and a stretch of forest the company's sustainability report described as a buffer zone under active protection. Quarter one: footprint matches the permit boundary, flaring stacks visible but unremarkable, forest edge where the disclosure said it would be. Fine. Filed it.
Quarter two is where it gets interesting, and not because anything dramatic happened. The tailings footprint had grown, maybe fifteen meters at the widest point along one embankment. On its own, in a single pass, that's noise. Impoundments expand and contract with throughput and season; a few meters of toe movement doesn't mean a dam is failing, and treating it like it does is how you end up crying wolf to a portfolio manager who then stops reading your memos. What it means is you now have a second data point, and a direction.
Quarter three confirmed the direction. Same embankment, same side, another measurable creep. We also picked up something the first two passes hadn't flagged: a cleared strip along the forest edge, inside the boundary the company had described as protected, that tracked with a new access road showing up in the same pass. Neither change was large enough to make a headline on its own. Together, across three quarters, they were a pattern, and the pattern didn't match the narrative in the sustainability report, which still described the buffer zone in present tense as if nothing had moved.
That's the part worth sitting with. The disclosure wasn't necessarily false when it was written. Site conditions had just moved past it, and nobody had gone back to check. This is the gap a quarterly screen is built for: the ordinary drift between what was true when someone filled out the questionnaire and what's true on the ground eighteen months later. Most of the time that drift is boring: a fence line a bit off, a road widened for maintenance access. Occasionally it's a tailings embankment moving in one direction for three consecutive quarters while the narrative stays frozen.
Quarter four gave us a clean enough change log that we had a real conversation with the investment team, a conversation quarter one never could have supported on its own.
The lesson for anyone setting up a new holding is less about the dam or the forest edge specifically than about discipline. A single pass tells you almost nothing, and four tells you a lot, and the only way to get from one to four is to build the first one properly, same boundary, same season-adjusted read, so quarter two has something honest to compare against. Skip that discipline and you're just looking at four unrelated pictures instead of one unfolding story.
If you're setting up coverage on a new position, the per-holding risk map and change log at ESG Screening is built for exactly this: a quarterly read you can stack, quarter on quarter, until the pattern tells you something the questionnaire didn't.
Start your own holding's baseline before the next reporting cycle locks you into last year's narrative.