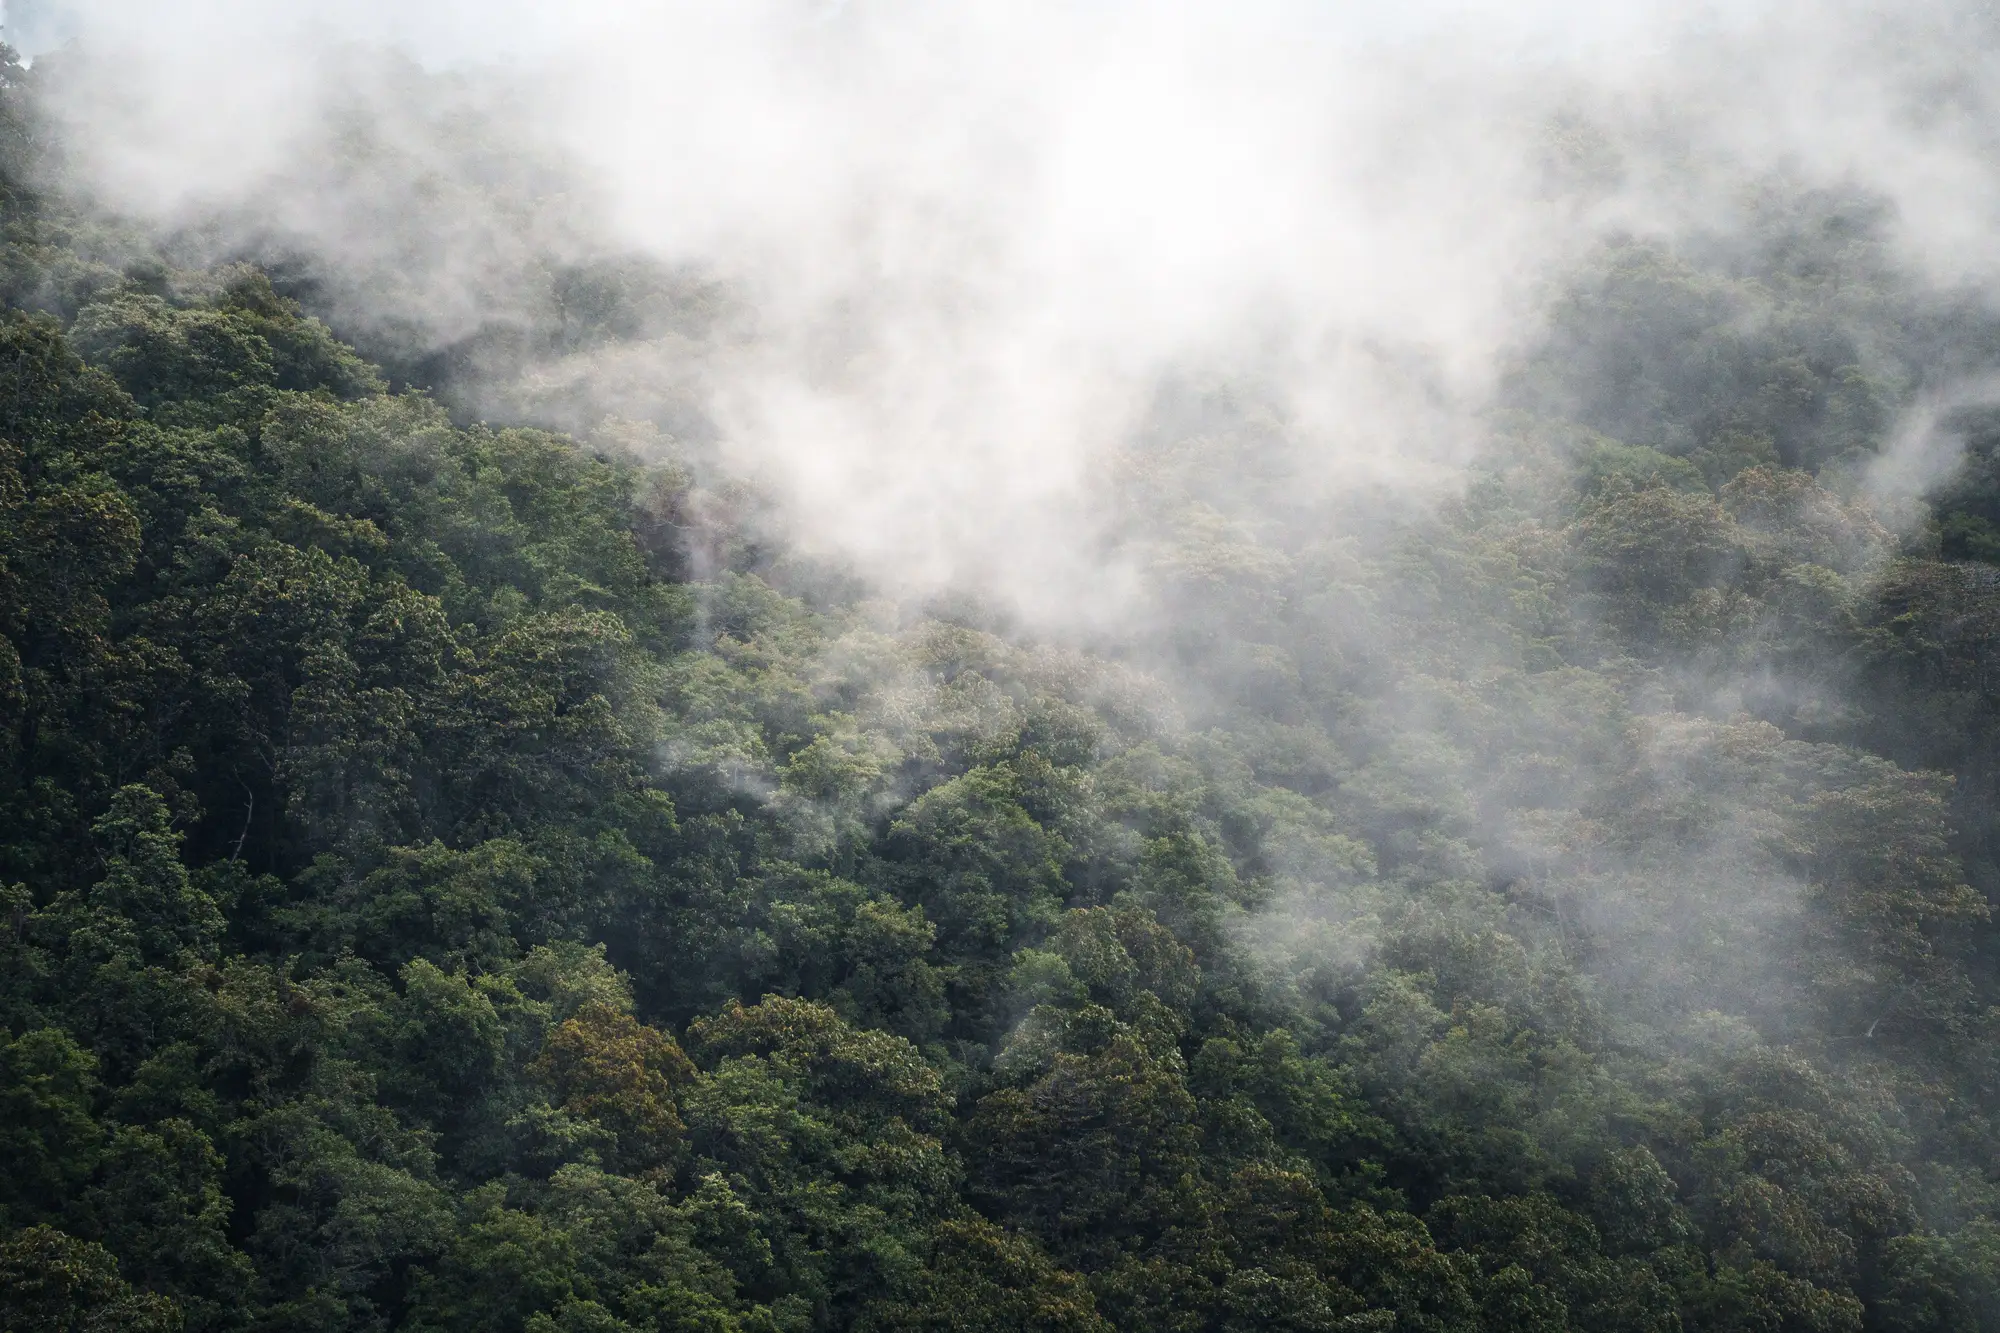
A portfolio company's annual disclosure says operations stay outside the buffer around a protected area. Your job is to check that claim against the imagery rather than take their word for it. Reading a scene for encroachment is a skill built on knowing what the signal looks like from above, and a first pass doesn't require a remote sensing degree.
What counts as encroachment on a buffer
Most protected areas carry a legally defined buffer, often set by the national park authority or under IUCN category rules, where extractive activity, clearing, or new construction is restricted even though the buffer itself isn't the core protected zone. The disclosure language usually references a fixed distance: "no operations within 2 km of the reserve boundary," that kind of thing.
Encroachment means activity that crosses that line. Proximity by itself, a concession boundary sitting right up against the buffer edge, is not the same thing as a violation. What you're looking for is physical change inside the buffer polygon: cleared ground, a new access road, a structure, a tailings footprint creeping past where it sat last quarter.
Reading the imagery: the signals that matter
A few things tend to show up before anyone files an incident report.
Canopy gaps. A clean-edged hole in forest cover that wasn't there in the prior pass is the most legible sign. Natural tree loss from disease or windthrow tends to look ragged. Clearing for access or extraction looks geometric: straight edges, right angles, a shape that matches equipment, not weather.
Access roads. Encroachment rarely starts with a building. It starts with a track. A thin line cutting into the buffer that wasn't on the previous scene, especially one that connects to an existing haul road or pad outside the boundary, is worth flagging even before anything else changes.
Spectral shift without obvious ground change. Multispectral bands pick up stressed or disturbed vegetation before it's visible as bare ground in a true-color image. A patch inside the buffer that reads differently in near-infrared from one quarter to the next, even if it still looks green, is an early flag worth logging.
Footprint creep at the edge. For mining assets, watch the boundary of the tailings footprint or the waste rock pile against the buffer line itself. The permit boundary is the wrong reference point for this check; the buffer line is the one that matters. Footprints expand gradually, and a few meters a quarter doesn't look dramatic in any single image. Lined up against four quarters in a row, the same creep reads very differently.
Why a single scene isn't enough
A single satellite pass tells you what the site looks like on one day. It can't tell you whether that gap in the canopy is new or whether it's been there for three years and nobody updated the KML file for the boundary. The signal is in the comparison: this quarter against last quarter, against the quarter before that, held against the same buffer polygon every time.
This is also where a lot of informal checks fall apart. An analyst pulls one recent image, eyeballs it against a rough map of the reserve, and calls it done. The boundary data is often outdated, the imagery resolution isn't fine enough to separate a genuine clearing from a shadow or a burn scar, and there's no change log to point to if the finding gets challenged six months later by the portfolio company's sustainability team.
A repeatable screen holds three things constant: the same buffer geometry every pass, a cadence tight enough to catch creep before it becomes a headline, and a record of what changed between dates. A single snapshot can give you a picture. It can't give you that record.
ESG Screening runs that comparison as a quarterly check against each portfolio company's site, flagging buffer encroachment alongside deforestation, flaring, and tailings-footprint change, and logging what moved between passes so the finding holds up when someone asks for the evidence behind it.
If your current process is a once-a-year glance at a satellite image before the disclosure gets signed off, it's worth seeing what a quarterly version of that check actually turns up.