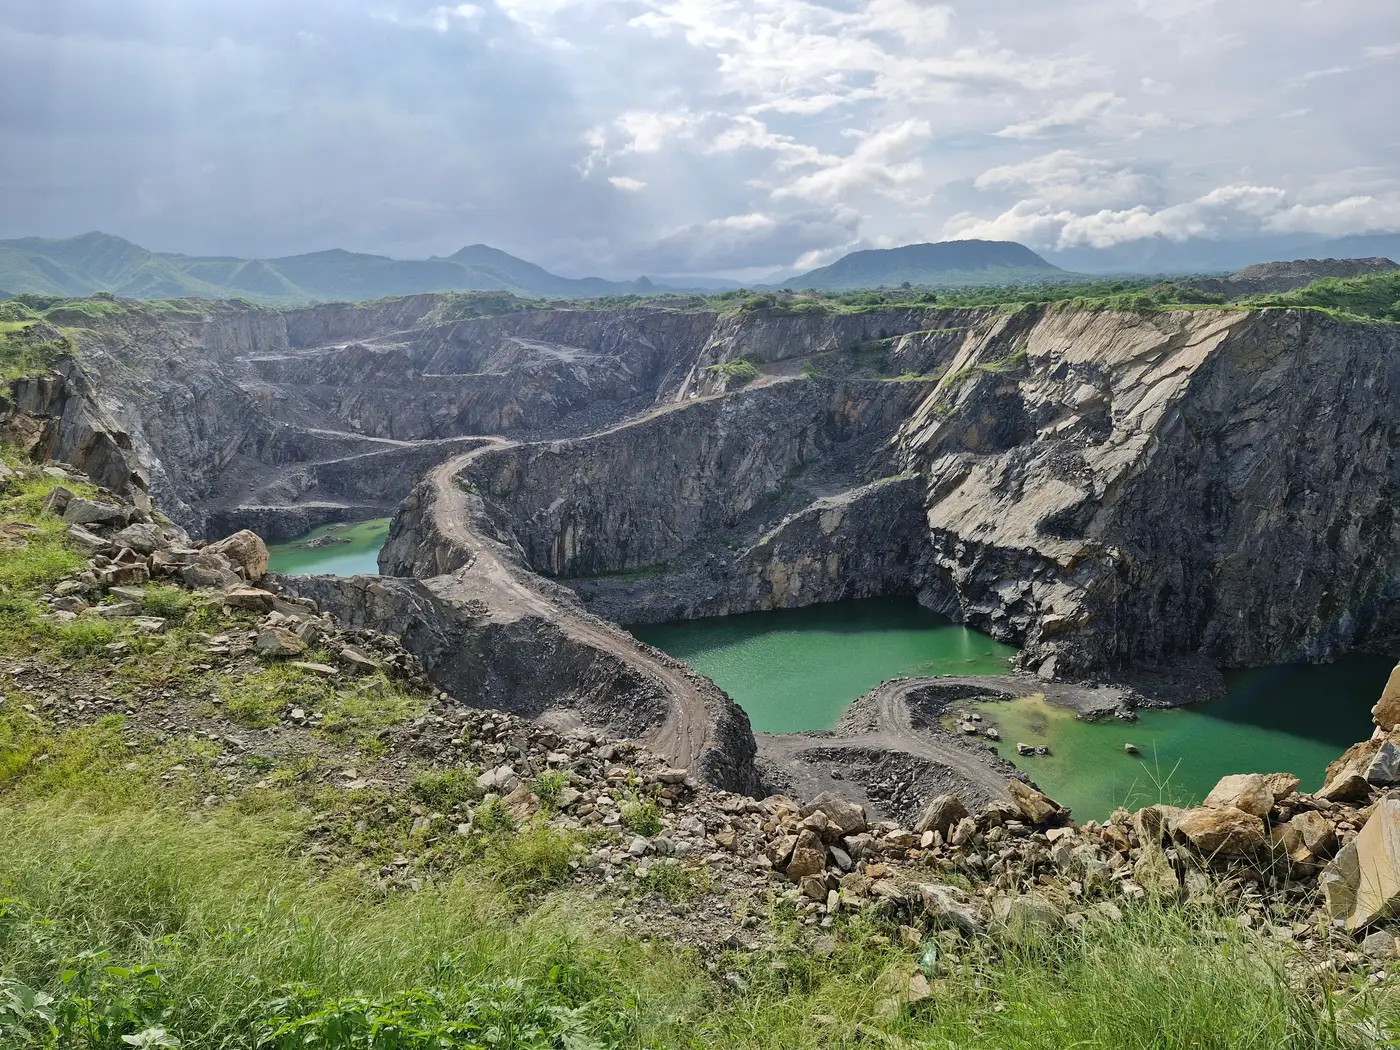
A tailings facility doesn't wait for your calendar. The embankment gets raised, a new cell gets added, a pond expands to hold more slurry, and none of it shows up in your file until someone goes back to look. If the last site visit was fourteen months ago, you're working from a picture of the facility that may no longer match what's actually there.
That gap is the real risk for a portfolio team reviewing tailings disclosures: the lag between what's on the ground and what's sitting in your review file.
What actually moves between visits
Tailings dams change in a handful of predictable ways, and most of them are visible from above if you know where to look:
- Wall height and crest length, as the operator raises the embankment on a downstream, upstream, or centerline method
- Pond surface area, which grows or shrinks with throughput and water management
- Footprint of the impoundment itself, as new cells or lifts get added
- Evidence of seepage, slumping, or new disturbed ground near the toe of the dam
Any one of these can show up in an annual report as a single line, "Stage 7 raise completed Q2," with no image attached. You're left trusting the narrative because there's no independent way to check it before the next visit.
Comparing two snapshots instead of waiting for the next one
The fix isn't booking a more frequent site visit. Flying someone to a mine site in Brazil or Zambia every quarter isn't a line item most stewardship budgets have. The fix is a way to compare what the facility looked like last review period against what it looks like now, without a person standing on the embankment.
That means, in practice:
- Pull a satellite image of the facility footprint from your last review period.
- Pull a current one, ideally from a similar point in the season so water levels don't confuse the comparison.
- Overlay the two and check the footprint boundary, pond extent, and any new disturbed ground adjacent to the dam.
- Flag anything that doesn't line up with the operator's stated raise schedule or disclosed capacity.
This isn't an engineering review, and it won't tell you whether the dam is structurally sound or whether the engineer of record signed off on the latest raise. What it tells you is whether the footprint moved in a way consistent with what the company reported, and whether that's worth a note to IR or a flag for the next engagement call. For a sector where Brumadinho and Brazil's other wall failures made the cost of a missed signal very concrete, that's a meaningful gap to close.
Where this fits in a disclosure review
If you cover more than a couple of extractives holdings, doing this overlay by hand for every site every quarter isn't realistic. Sourcing imagery, georeferencing it, and measuring change across a portfolio of mine sites eats a week you don't have, and the output only holds up as well as the analyst who last did it.
That's the problem a quarterly pass across a portfolio is built to handle: medium-resolution satellite imagery checked against the last pass to flag deforestation, tailings-dam footprint change, gas flaring, and encroachment, delivered per holding as a risk map and change log. It's built for exactly the gap above, catching dam wall expansion between site visits instead of a year after the fact.
If a footprint that's grown faster than disclosed would change how you score a holding, it's worth running that check quarterly rather than waiting for the next flight out. See how ESG Screening sets up that check for your portfolio.