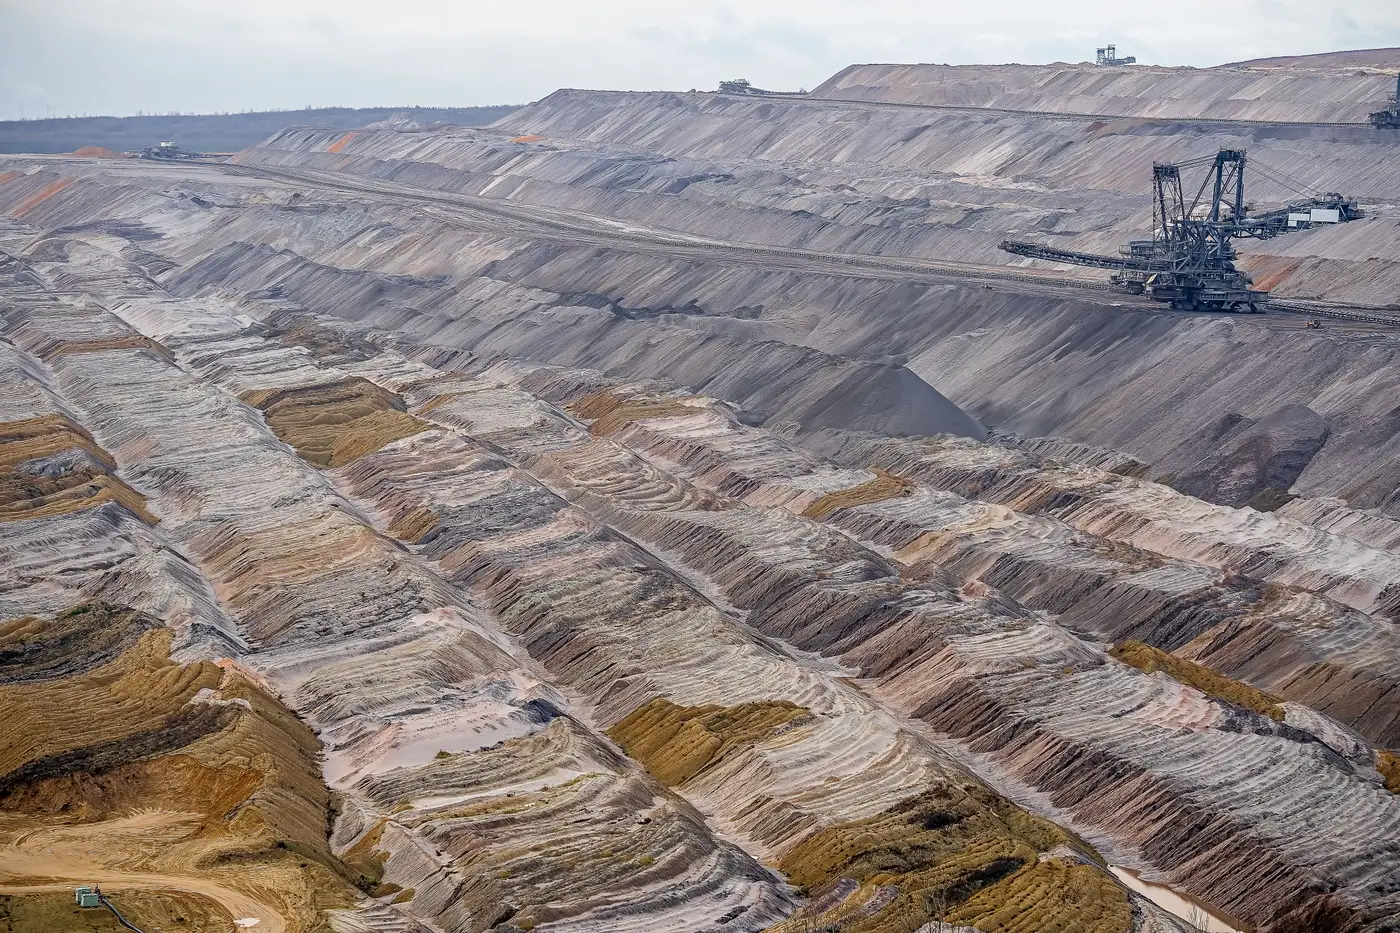
A per-holding risk map is exactly what it sounds like: one map, per company you hold, showing what's changed on the ground at its physical sites since the last time anyone looked. Not a sector heat map. Not a composite ESG score with a methodology appendix. A site-level view tied to a specific holding in your book, updated on a cadence, with a record of what moved.
For a stewardship team, that distinction matters more than it sounds like it should. Most of what lands on your desk is self-reported: the sustainability report, the CDP response, the mine-closure plan the company filed with a regulator somewhere. A per-holding risk map checks that disclosure against something the company didn't write.
What's on the map
Each holding gets its own layer stack built from satellite passes, typically at 3-10 m resolution, refreshed quarterly. The screen flags four things that tend to diverge from what gets disclosed: deforestation near a concession boundary, footprint change on a tailings dam, gas flaring at a facility that reported flare reduction, and encroachment, new structures or clearing pushing into a buffer zone that wasn't there last quarter.
What you get is a map of the site with the flagged areas marked, and a change log underneath it listing what moved, where, and between which two passes. If a tailings facility's footprint grew by a visible margin since Q2, that's a line in the log, not a paragraph of prose explaining it away.
The resolution matters here too. Medium-resolution multispectral imagery won't tell you the dam is structurally unsound, and it won't count trucks in a yard. What it will do is show you that the impoundment area is larger than it was last quarter, or that the tree line a company's land-use disclosure says is intact has a gap in it. That's a flag, not a verdict. It tells you where to point a question.
Reading the change log before the engagement call
The useful habit is to open the risk map the week before an engagement call, well ahead of the week you file the proxy. Walk through the change log line by line against what the company's own disclosure says for that site. Three outcomes, roughly:
Nothing flagged, and the disclosure matches what you'd expect. File it, move on. That's most holdings, most quarters.
Something's flagged that the company already disclosed. A flare event tied to planned maintenance, say, that shows up in both the imagery and the footnotes. That's confirmation the disclosure is holding up against the ground truth.
Something's flagged that nothing in the disclosure explains. That's the one you bring to the call. Not as an accusation, as a specific question: the tailings footprint at the Site X facility grew roughly this much since the last pass, can you walk us through what's going on there. Companies answer that kind of question differently than they answer "tell us about your tailings risk management."
What it doesn't do
It won't generate your voting rationale and it won't score the company for you. It's a cross-check, built to sit alongside the disclosure review you're already doing, not instead of it. If a site shows no flags for three straight quarters, that's useful information too. It's one less thing to chase down before the AGM.
For a team covering a book of holdings across mining, oil and gas, and land-intensive sectors, the value sits in running the same screen against every holding on the same cadence, so a flagged dam footprint at one company and a quiet quarter at another aren't an accident of who happened to file a detailed disclosure and who didn't. ESG Screening builds that per-holding map and change log on a quarterly pass, so the gap between what's filed and what's visible on site becomes something you can point to.
If you're building out a stewardship process that needs that kind of cross-check running quarterly, it's worth a look.